How to Measure Notion and AI Adoption in Your Organization - Notion Workspace Analytics (Enterprise)
If you’re rolling out Notion (or any new system in general) across your team(s), you're probably wondering: is anyone actually using it?
Implementing Notion across a team of 10+ people is an exercise in change management. This means that adopting Notion as a new tool—or expanding its use across the team—requires system-level evolution, which is met with friction and resistance, as is typical for any change in humans. Resistance itself is not an issue—rather a natural response to a reshuffle, no matter how small it may seem to you. Resisting the resistance can create unnecessary leakages and energy loss throughout the system. Instead, we can understand the source of the resistance and proceed with patience, assuming the new systems are useful and aligned with the overall strategy.
Research shows that most tool rollouts fail not because of the technology but because of leadership factors such as poor communication and resistance to change (Greenhalgh et al., 2017). Change management is a vast topic with many layers in business literature, and for valid reasons. Change always happens, yet is often opposed, especially when introduced within a group of people with specific ways of “doing things around here.”
One thing is true when it comes to making a system change, as Seth Godin often underlines in “This Is Strategy”: for evolution to happen, the incentives must be aligned with the desired system change. That is, there must be clear incentives for adopting the new tool, and everyone’s (the majority’s) interest must be aligned instead of siloed.
Incentives can mostly take the form of money, status, or affiliation—all fundamental human desires that drive most of our actions, especially when operating in a group environment. Money incentives are bonuses or specific monetary rewards linked to the new tool usage/adoption. Status incentives can include badges, seniority level increases, more decision-making power, public prizes, and other rewards that put the person in a positive light in front of other people.
“Each person in a system will always act in their self-interest. … A healthy system is organized in a way that self-interest leads to behavior that’s in the common good. People sign up for the systems that give them what they seek, and they stay as long as their needs are being met. […]
The work of change-making is to help people decide that changing their actions is exactly what they want to do. Not because it’s important to us, but because it’s important to them. […]”
Notion Workspace Analytics Overview
This is where workspace analytics become useful: they give you the data to design and measure those incentives. They are one component to shed light on the actual system change status.
Workspace analytics (available on the Enterprise plan) let you measure adoption across the Notion workspace and Notion AI features. There is a dedicated tab for Analytics accessible under the workspace settings, visible to workspace owners, organization owners, and membership admins (learn more about workspace roles here). This tab is further split into sub-tabs that highlight workspace and AI analytics. The design and functionalities of workspace analytics are often evolving, so you may find new metrics not mentioned in this essay by the time you read this. The fundamental concept of analytics remains the same.
There are two types of analytics for the Notion workspace (both can be accessed under Settings > Analytics in any Enterprise workspace): general usage analytics and AI usage analytics. General usage analytics show active users (those who viewed a page), which pages are most used, and how engagement trends over time. You can adjust the timeframe for the last 7, 30, 90, or 365 days. There are four workspace analytics tabs:
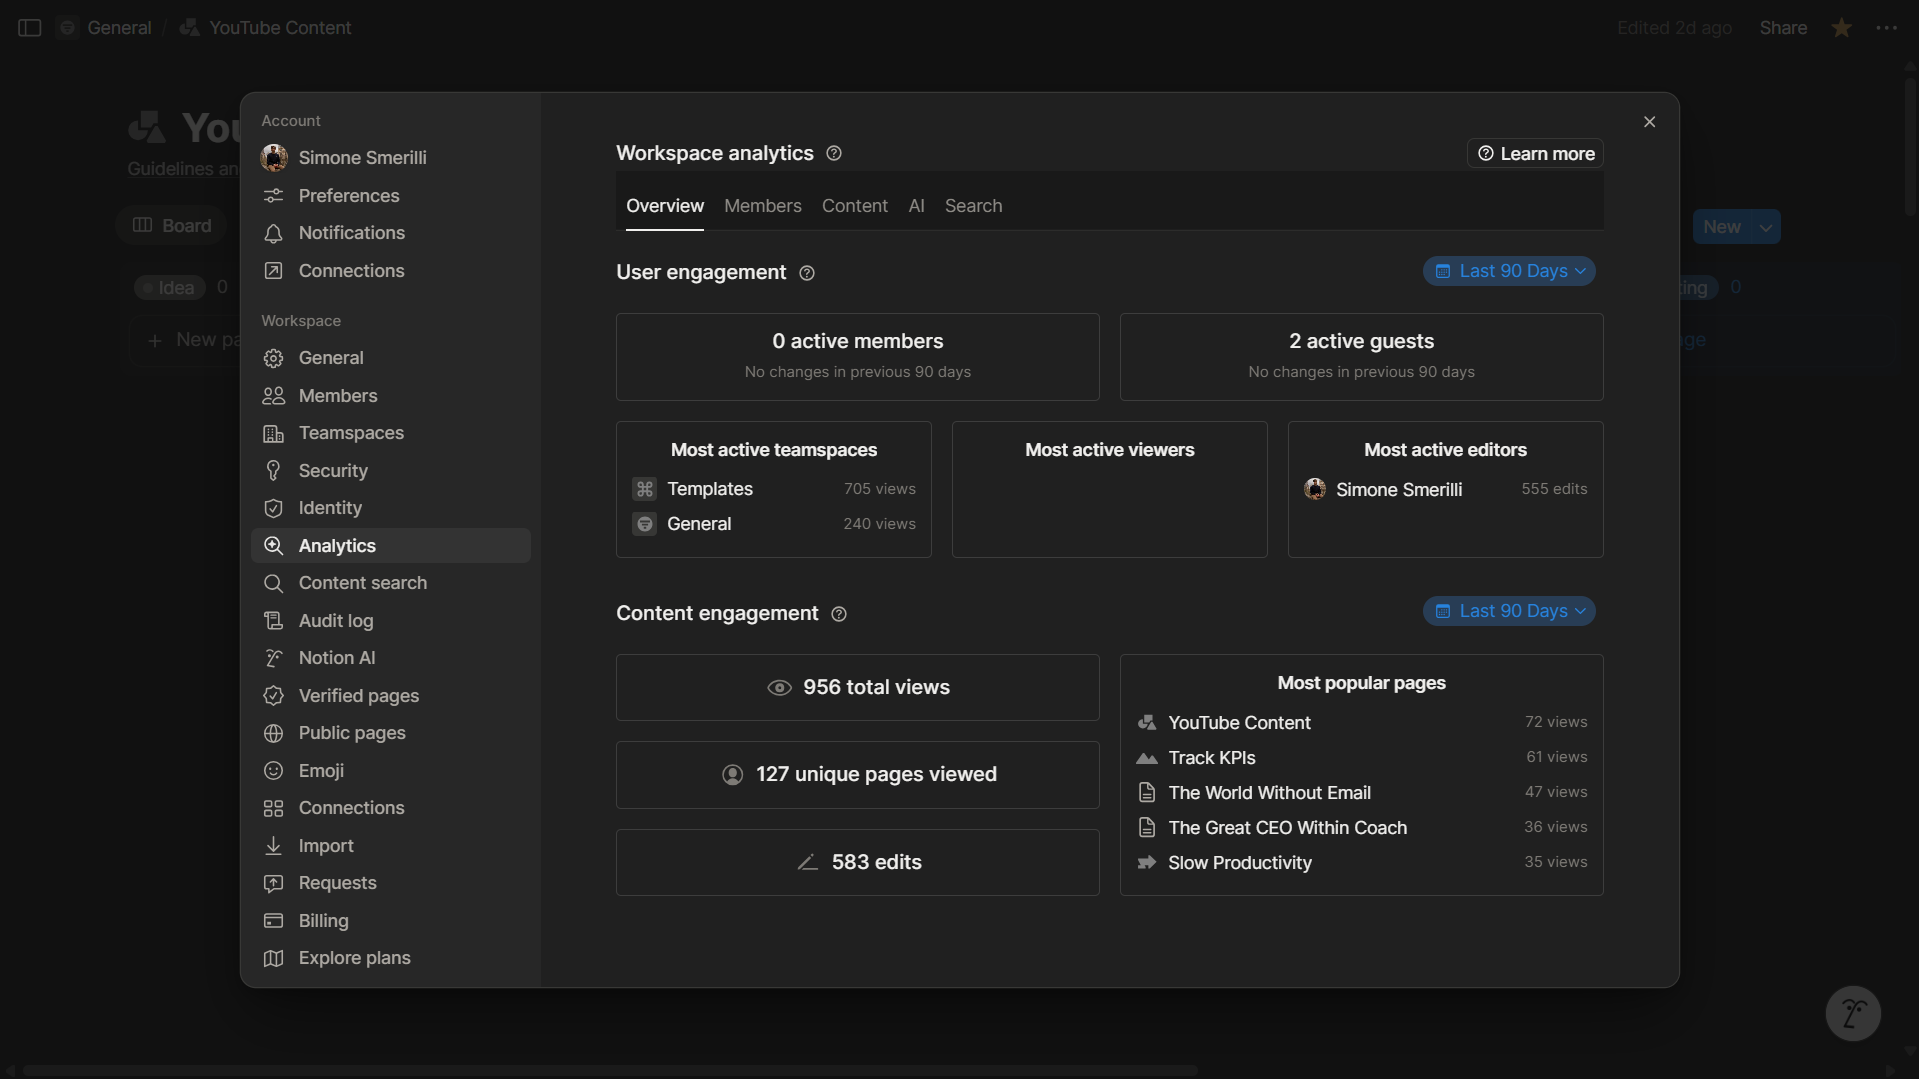
The “Overview” tab of workspace analytics shows some aggregate metrics, which can be further analyzed in the other tabs (Members, Content).
Overview: here, you can visualize high-level metrics about active members, guests, and content engagement.
Members: In this tab, you can drill down into active members and guests, including a chart showing active members over the selected period, and an exportable table displaying each user’s engagement across the Notion workspace (page views, edits, last active, teamspace access). Find out more about the differences between a member and a guest here.
Content: This is where you can see content engagement metrics (page views and unique views across any page in the workspace, including private ones). The list of page views and audience (whether a page is private, public, or shared) is filterable and exportable in CSV format.
Search: as the official documentation reads: “In the
Searchtab, you can understand what workspace members are searching for, the number of times and the click-through rate of each query. These metrics can help you identify potential gaps in your documentation as well as help you make changes to content to improve discovery.”
AI usage analytics show whether workspace members are using Notion AI. Here you can see AI Utilization percentage (the percentage of active members who used AI in the selected period), a chart of AI actions (connectors, Agent, Meeting Notes, …), and exportable CSVs of total AI actions by user and top pages returned by AI responses.
Conclusion
Data gives you leverage: you can dig into the actual numbers instead of defending the tool qualitatively. This provides you with tangible feedback (the truth) that can inform your change strategy toward the desired outcome. Certainly, it takes patience, especially if the new tool represents a significant novelty in your system. Seeing unsatisfactory numbers after only a few weeks is not a sign of failure, since, as mentioned earlier, system change takes time, effort, and sticking with the strategy long-term. By the same token, ignoring the data in favor of confirmation and sunk cost biases is counterproductive. But if your interest is the common interest, you can see through your short-sightedness and course-correct accordingly.
If you wish to build your custom workflows with intention, submit your interest here.